tcarson4344 | 2020-05-25 18:50:14 UTC | #1
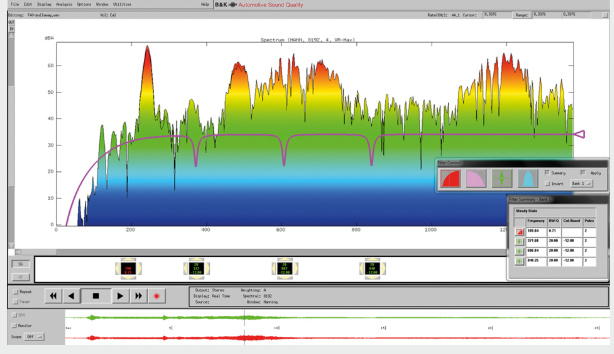
is pyqtgraph the best choice if I wanted to build an audio editor? I know there are a lot of good free audio editors out there, but I and looking to do something meant for sound quality engineering. the screenshot below shows the left and right time series at the bottom with the running spectrum and some dsp filtering in the top plot. Looking for ideas to accomplish in python
martin | 2020-05-25 19:38:31 UTC | #2
Yep, for something like this I would definitely recommend PyQtGraph. It's got two main advantages over matplotlib --
- it uses native Qt drawing, so it's fast, but you can also extend with custom widgets to add markers/etc. very easily.
- interactions are far more natural, particularly for zooming panning
I created something similar for NMR spectra, with a overview plot and then scalable/zoomable main plot + annotations. You can take a look here if it helps https://github.com/mfitzp/nmrbrew/blob/master/nmrbrew/spectra.py
There will be some more PyQtGraph tutorials in future, so if there is something specific you need let me know.

Also available from Leanpub and Amazon Paperback
Purchasing Power Parity
Developers in [[ country ]] get [[ discount.discount_pc ]]% OFF on all books & courses with code [[ discount.coupon_code ]]tcarson4344 | 2020-05-25 19:38:21 UTC | #3
Thanks Martin,
I will start playing with PyQtGraph. I will also look at the link.
Create GUI Applications with Python & Qt5 by Martin Fitzpatrick — (PyQt5 Edition) The hands-on guide to making apps with Python — Over 15,000 copies sold!
I have some more basic questions, But I will start another topic.
thanks again
Packaging Python Applications with PyInstaller by Martin Fitzpatrick — This step-by-step guide walks you through packaging your own Python applications from simple examples to complete installers and signed executables.
