rbelyalov21065391 | 2020-07-15 08:18:11 UTC | #1
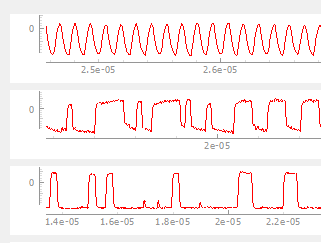
Hi, I would like to have several signal graphics (ViewBox elements) being scaled at the same time (not each one in its own area) without merging them into one shared area. Any ideas?
Thanks

Luca | 2020-07-18 10:57:15 UTC | #2
https://www.pythonguis.com/courses/graphics-plotting/plotting-pyqtgraph/ There is the "plotting multiple line section".
martin | 2020-07-19 20:11:46 UTC | #3
Create GUI Applications with Python & Qt6 by Martin Fitzpatrick — (PyQt6 Edition) The hands-on guide to making apps with Python — Over 15,000 copies sold!
Hey @rbelyalov21065391 welcome to the forum. I'm not sure I understand what you mean exactly --
By not merging them into one shared area do you mean you want to keep the individual plots distinct? But you want them all to share the same magnitude scale?
Purchasing Power Parity
Developers in [[ country ]] get [[ discount.discount_pc ]]% OFF on all books & courses with code [[ discount.coupon_code ]]If that's what you're after, I think the easiest solution would be to calculate the scale yourself (find the min/max of your data) and then apply that same scale to all the plots.
If instead you want to lock the x (or y) axis together across multiple plots, take a look at .setXLink() and .setYLink() on the ViewBox object. This allows you to link panning/scaling of plots together.
Packaging Python Applications with PyInstaller by Martin Fitzpatrick — This step-by-step guide walks you through packaging your own Python applications from simple examples to complete installers and signed executables.

